Image Details
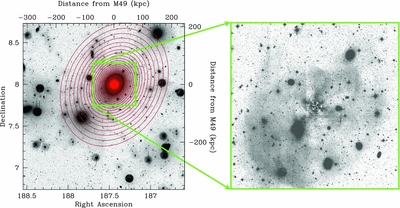
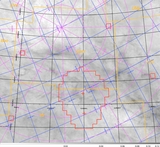
Caption: Figure 19.
Left panel: a 2° × 2° g-band image of the core of Virgo's B subcluster, from the NGVS. The lower and left axes show right ascension and declination, respectively, while the upper and right axes measure distance from the center of M49, in kpc (assuming a distance to Virgo of 16.5 Mpc). The red ellipses show the best-fit isophotes to M49; the surface brightness azimuthally averaged along these isophotes is shown in Figure 18. Right panel: a 31′ × 31′ (149 × 149 kpc) region centered on M49 (i.e., the regions enclosed within the green box in the left panel), showing residuals obtained by subtracting from the actual image the model that best represents the azimuthally averaged elliptical isophotes. Note the extensive structure of shells and filaments. The central "wheel-like" residuals are indicative of higher-order components in the isophotal shapes compared to a simple ellipse.
Other Images in This Article

Show More
Copyright and Terms & Conditions
© 2012. The American Astronomical Society. All rights reserved.