Image Details
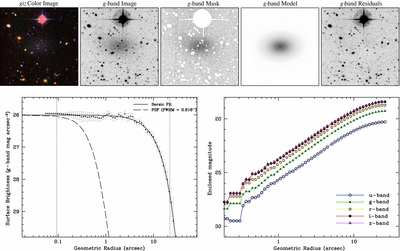
Caption: Figure 17.
NGVS data and data products for a low surface brightness galaxy in the Virgo cluster core, detected by visually inspecting the NGVS images. The top row shows 1′.55 × 1′.55 cutouts of (from the left to right) a composite giz color image, the g-band image, the mask applied to the image prior to performing the isophotal analysis of the galaxy, the isophotal model that best represents the galaxy, and the original image from which the model has been subtracted. The cutouts are generated by a newly developed algorithm that automatically identifies and then recovers structural parameters for galaxies within the NGVS footprint. The bottom left plot shows the g-band azimuthally averaged surface brightness profile of the galaxy, together with the PSF-convolved Sérsic model best fitting the profile. The PSF profile, derived for a PSF generated at the location of the galaxy center by an automated implementation of the DAOPhot algorithm (Stetson 1987), is shown by the dashed line. The bottom right panel shows non-parametric curves of growth in all five NGVS bands.
Other Images in This Article

Show More
Copyright and Terms & Conditions
© 2012. The American Astronomical Society. All rights reserved.