Image Details
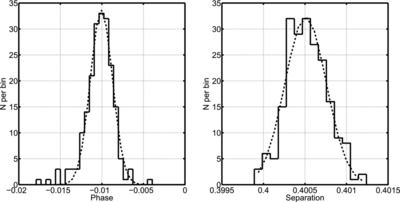
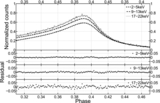
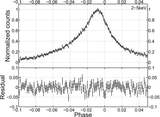
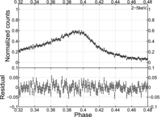
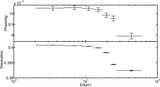
Caption: Figure 8.
Left panel: the distribution of the phase lag between the X-ray main peak and the radio main peak of the Crab pulsar with bin size 5.8 × 10 −4 periods. The dashed line represents the fitted Gaussian function with μ = −0.0101 and σ = 1.3 × 10 −3. Right panel: the distribution of the separation between the two X-ray peaks with bin size 9.6 × 10 −5 periods. The dashed line represents the fitted Gaussian function with μ = 0.4005 and σ = 2.5 × 10 −4.
Other Images in This Article
Show More
Copyright and Terms & Conditions
© 2012. The American Astronomical Society. All rights reserved.
Copyright ©
2025 Astronomy Image Explorer. All Rights Reserved.