Image Details
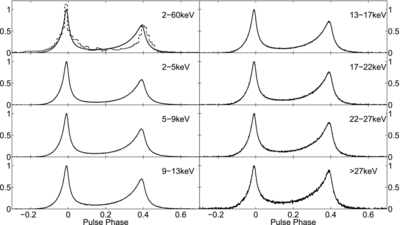
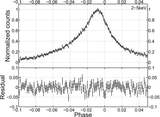
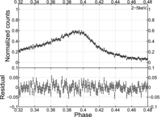
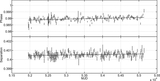
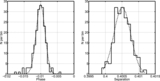
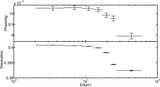
Caption: Figure 2.
X-ray profiles of the Crab pulsar in different energy ranges. Phase 0 represents the position of the main radio peak. The dashed line represents the result of the theoretical model (Jia et al. 2007).
Other Images in This Article
Show More
Copyright and Terms & Conditions
© 2012. The American Astronomical Society. All rights reserved.
Copyright ©
2025 Astronomy Image Explorer. All Rights Reserved.