Image Details
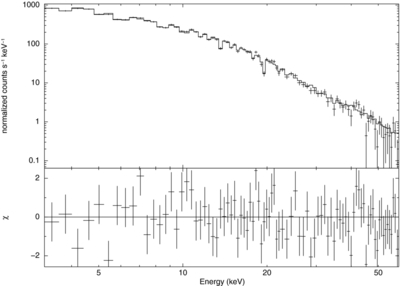
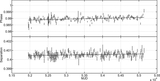
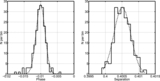
Caption: Figure 10.
Spectral fit of the Crab pulsar with an absorbed power law ( N H = 0.36 × 10 22 cm −2) at phase: 0.0–0.005. Upper panel: the crosses represent the observations, and the solid line is the model convolved with the response matrices. Lower panel: the residuals between the observation data and the best-fitted model. The reduced χ 2 is 0.99 with the degree of freedom 86.
Other Images in This Article
Show More
Copyright and Terms & Conditions
© 2012. The American Astronomical Society. All rights reserved.
Copyright ©
2025 Astronomy Image Explorer. All Rights Reserved.