Image Details
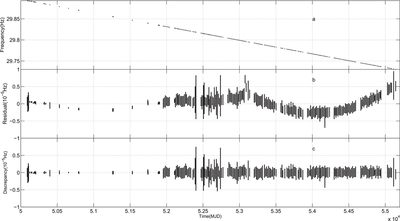
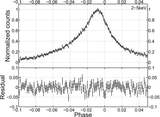
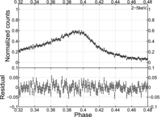
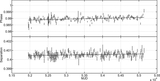
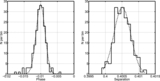
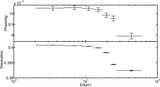
Caption: Figure 1.
Timing result of the Crab pulsar. Panel (a) shows the frequency evolution, panel (b) shows the frequency residuals of the fit with Equation (1), and panel (c) shows the differences between the frequencies measured by X-ray observations and those calculated from the radio ephemeris.
Other Images in This Article
Show More
Copyright and Terms & Conditions
© 2012. The American Astronomical Society. All rights reserved.
Copyright ©
2025 Astronomy Image Explorer. All Rights Reserved.