Image Details
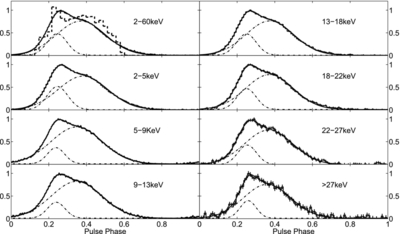
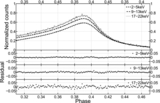
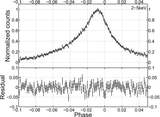
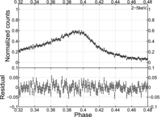
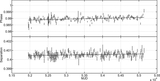
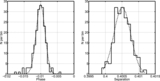
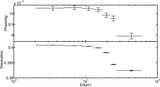
Caption: Figure 15.
X-ray profiles of PSR B1509−58 in different energy ranges. The two dot-dashed lines represent the two Gaussian components used to fit the pulses. The dashed line represents model result (Zhang & Cheng 2000).
Other Images in This Article
Show More
Copyright and Terms & Conditions
© 2012. The American Astronomical Society. All rights reserved.
Copyright ©
2025 Astronomy Image Explorer. All Rights Reserved.