Image Details
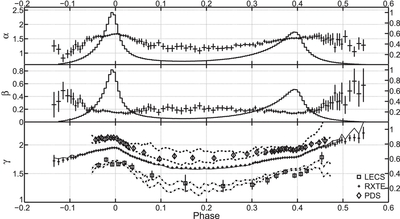
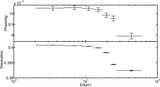
Caption: Figure 13.
Results of the phase-resolved spectra of the Crab pulsar with log-parabola model in different phase ranges. Upper panel: the parameter α in the log-parabola model. Middle panel: the parameter β in the log-parabola model. Bottom panel: the comparison of the photon indices of the power-law model and spectral indices calculated from Equation (5), where E = 1.5, 9.3, 30.0 keV. The solid line represents the energy-dependent photon indices for RXTE. The two dot-dashed lines represent 1σ uncertainties from the extrapolation of the spectral distribution for LECS of BeppoSAX. The dashed lines are similar to dot-dashed lines but for PDS of BeppoSAX. The square, "+," and diamond points represent the results of LECS, PCA, and PDS, respectively.
Other Images in This Article
Show More
Copyright and Terms & Conditions
© 2012. The American Astronomical Society. All rights reserved.