

Image Details
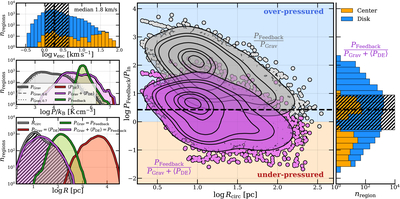
Caption: Figure 4.
Top left: distribution of H II region escape velocities in galaxy centers and disks. Middle left: distribution of pressures due to H II region self-gravity for ﹩{M}_{{\rm{sh}}}=50 \% {M}_{{\rm{Mol}}}^{{\rm{init}}}﹩ (fiducial value; solid gray), ﹩60 \% {M}_{{\rm{Mol}}}^{{\rm{init}}}﹩ (dashed gray), and ﹩70 \% {M}_{{\rm{Mol}}}^{{\rm{init}}}﹩ (dotted–dashed gray); disk 〈PDE〉 (from J. Sun et al. 2023; maroon); fiducial PGrav + 〈PDE〉 (purple), and total PFeedback (green). Bottom left: distribution of H II region Rcirc (gray hatches) and the sizes at which we expect PGrav = 〈PDE〉 (maroon), PGrav = PFeedback (green), and PGrav + 〈PDE〉 = PFeedback (purple). Right: H II region overpressure (shaded blue) vs. underpressure (shaded orange) for PFeedback/PGrav (gray) and PFeedback/(PGrav + 〈PDE〉) (purple; the dashed line indicates the median, with a summary histogram to the right) with 5th/16th/25th/50th/75th/84th/95th percentile contours.
Other Images in This Article
Copyright and Terms & Conditions
© 2025. The Author(s). Published by the American Astronomical Society.

