

Image Details
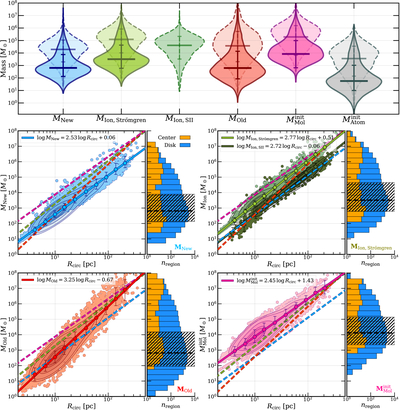
Caption: Figure 1.
The distribution of masses associated with our sample of ∼18,000 H II regions (solid violins) and the subsample of ∼4000 regions where we can calculate [S II] densities (dashed violins), including contributions from young clusters (MNew, in blue; see Section 2.1.1), ionized gas mass (MIon, Strömgren in light green and [S II]-emitting clump in dark green; see Section 2.1.2), old stellar mass (MOld, in red; see Section 2.1.3), initial molecular gas mass (﹩{M}_{{\rm{Mol}}}^{{\rm{init}}}﹩, in pink; Section 2.2.1), and initial atomic gas mass (﹩{M}_{{\rm{Atom}}}^{{\rm{init}}}﹩, in gray; Section 2.2.2) as violin plots with the median and 16th–84th range included. Below we show how MNew, MIon, MOld, and ﹩{M}_{{\rm{Mol}}}^{{\rm{init}}}﹩ scale with physical size (Rcirc). Contours show the 16th/25th/50th/75th/84th percentiles, and we include ﹩\mathrm{log}\unicode{8210}\mathrm{log}﹩ fits (bold lines, repeated as dashed lines in each panel) to the binned medians (hexagons) and the 16th–84th percentile scatter in each bin (error bars on hexagons). Attached to each scatter plot are stacked histograms of region masses for galaxy centers (orange) and disks (blue) (following M. Querejeta et al. 2021), the sample median (dashed line), and the 16th–84th percentile range (hatches).
Other Images in This Article
Copyright and Terms & Conditions
© 2025. The Author(s). Published by the American Astronomical Society.

