

Image Details
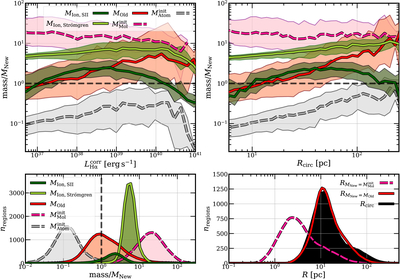
Caption: Figure 2.
Variation in the different mass components relative to the young cluster mass MNew for the full sample of H II regions, binned in LHαcorr (top left) and Rcirc (top right) and summarized as histograms (bottom left). MIon, S II/MNew (dark green), ﹩{M}_{{\rm{Ion}}},{\rm{Str}}\ddot{{\rm{o}}}{\rm{mgren}}/{M}_{{\rm{New}}}﹩ (light green), MOld/MNew (red), ﹩{M}_{{\rm{Mol}}}^{{\rm{init}}}/{M}_{{\rm{New}}}﹩ (dashed pink), and ﹩{M}_{{\rm{Atom}}}^{{\rm{init}}}/{M}_{{\rm{New}}}﹩ (dashed gray) are included for comparison. The dashed line indicates where a mass component is equal to MNew. The bottom right panel includes the distribution of the measured Rcirc (black), the estimated radius at which ﹩{M}_{{\rm{New}}}={M}_{{\rm{Mol}}}^{{\rm{init}}}﹩ (dashed pink), and the radius where MNew = MOld (red).
Other Images in This Article
Copyright and Terms & Conditions
© 2025. The Author(s). Published by the American Astronomical Society.

