

Image Details
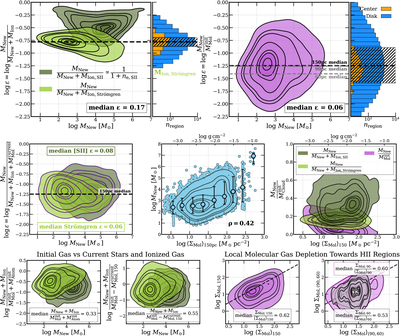
Caption: Figure 3.
Top: summarizing H II region-scale SFEs. Data density contours for the 5th/16th/25th/50th/75th/84th/95th percentile SFE using MIon,S II (dark green), ﹩{M}_{{\rm{Ion}}},{\rm{Str}}\ddot{{\rm{o}}}{\rm{mgren}}﹩ (light green), and ﹩{M}_{{\rm{Mol}}}^{{\rm{init}}}﹩ (purple). The full histogram and medians as before (dashed line) for ﹩{M}_{{\rm{Ion}}},{\rm{Str}}\ddot{{\rm{o}}}{\rm{mgren}}﹩ and ﹩{M}_{{\rm{Mol}}}^{{\rm{init}}}﹩ are included. We also include the medians using ﹩{M}_{{\rm{Mol}}}^{{\rm{init}}}﹩ at 90–60 pc resolution. Middle: from left to right, the fraction of current gas and stars in young stars, the moderate correlation (Spearman ρ = 0.42) and large scatter between MNew and ﹩{\langle {{\rm{\Sigma }}}_{{\rm{Mol}}}\rangle }_{150\,{\rm{pc}}}﹩, and three estimates of MNew/MCloud vs. ﹩{\langle {{\rm{\Sigma }}}_{{\rm{Mol}}}\rangle }_{150\,{\rm{pc}}}﹩. Bottom: from left to right, the fraction of initial gas seen in stars and ionized gas, the fraction of depleted initial molecular gas in stars and ionized gas, the statistical local depletion in molecular gas toward H II regions at our fiducial 150 pc resolution, and finally, the depletion for smaller samples (where available) at 90 pc (purple) and 60 pc (gray) resolution, relative to the dashed black 1:1 line.
Other Images in This Article
Copyright and Terms & Conditions
© 2025. The Author(s). Published by the American Astronomical Society.

