Image Details
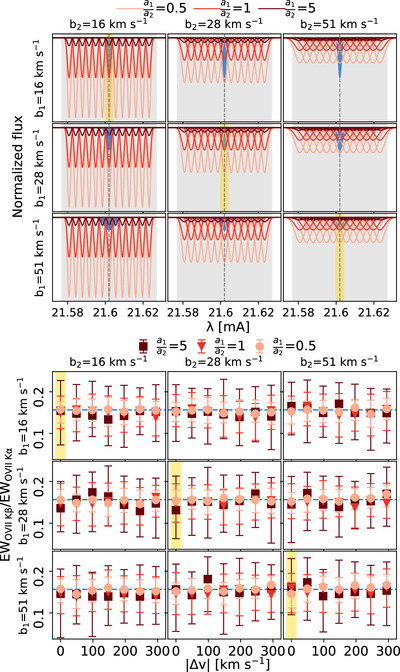
Caption: Figure 4.
Top: illustration of the two Gaussian input models for O VII Kα in simulated spectra. The yellow shaded regions denote the subset of models where two Gaussians effectively converge to one Gaussian. The broadening of input lines in each panel is labeled on the y-axis and upper x-axis. The first Gaussian is shown in blue. Different shades of red denote three different amplitudes of the second Gaussian (see the legend). The second Gaussian is shown for 13 line-of-sight (LOS) velocities. For each combination of line broadening, line amplitude ratio, and LOS velocity, the input is the first Gaussian and one of the 3 × 13 red shaded Gaussians. The vertical gray dashed line and the shaded region correspond to the z = 0 wavelength of O VII Kα and the resolution element (of LETG), respectively. Models for O VII Kβ would look similar except for the amplitude of all lines being weaker. Bottom: the ratio of best-fitted EW of O VII Kβ and O VII Kα lines each modeled with one Gaussian as a function of LOS velocity difference, ∣Δv∣, between the two input Gaussians. Different symbols denote different amplitude ratios of the two input Gaussians (see the legend). The broadening of input Gaussians is mentioned next to each panel. The results are the same for positive and negative LOS velocity, thus effectively there are seven ∣Δv∣ for each combination of line broadening and line amplitude ratio. The horizontal dashed blue line in each panel corresponds to the EW ratio of unsaturated O VII lines.
Other Images in This Article
Copyright and Terms & Conditions
© 2024. The Author(s). Published by the American Astronomical Society.