Image Details
Caption: Figure 1.
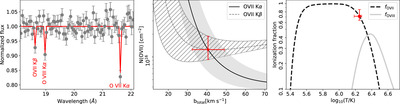
Left: normalized unfolded spectrum toward one of the sightlines. The z = 0 absorption lines of O VII Kα, O VII Kβ, and O VIII Kα are shown. Middle: contours of N(O VII) and total broadening of O VII, b total for the measured equivalent widths of Kα and Kβ lines toward the same sightline. The saturation-corrected N(O VII) and corresponding b total are shown with the red point. Right: ionization fraction of O VII and O VIII, X O VII and X O VIII , as a function of temperature in collisional ionization equilibrium. The temperature and X O VII toward the same sightline obtained from the column density ratio of O VIII and O VII (see Equation (3b)) is shown with the red point.
Other Images in This Article
Copyright and Terms & Conditions
© 2024. The Author(s). Published by the American Astronomical Society.