Image Details
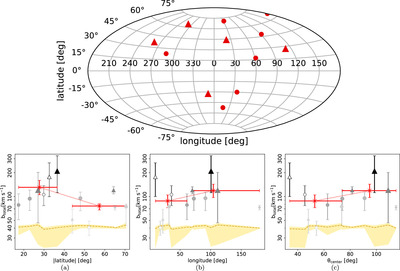
Caption: Figure 3.
Top: sky distribution of the sightlines, with Chandra and XMM-Newton data shown with circles and triangles. Bottom: O VII line broadening at different galactic latitudes (left), longitudes (middle), and angle from the Galactic center, θ center (right). The binned line broadening is shown with the red points. The grayscale symbols’ size, shape, and shades are the same as Figure 2. Sightlines in the southern hemisphere (b < 0) are shown with unfilled symbols. The thermal broadening is shown with the dashed brown curves and the yellow-shaded region. Nonthermal line broadening is evident toward sightlines at lower galactic latitudes. The correlation between nonthermal line broadening and galactic longitude or θ center is weak/negligible.
Other Images in This Article
Copyright and Terms & Conditions
© 2024. The Author(s). Published by the American Astronomical Society.