Image Details
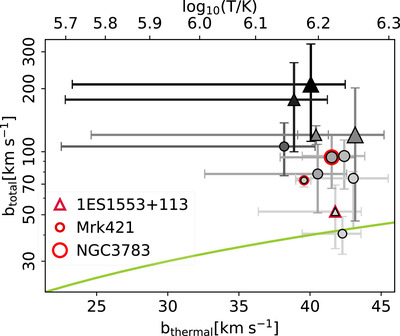
Caption: Figure 2.
Comparison between thermal and total broadening of O VII lines. The temperature corresponding to the thermal broadening is shown in the upper x-axis. The shade and size of the symbols are proportional to N(O VII) and N(O VIII), respectively, with darker symbols having larger N(O VII) and larger symbols having larger N(O VIII). Measurements from Chandra and XMM-Newton are shown with circles and triangles, respectively. The green curve denotes the total broadening expected in the absence of nonthermal broadening. In 8 out of 12 sightlines nonthermal broadening is evident. Three sightlines where the presence of a super-virial ≈107 K hot phase coexisting with the virial ≈106 K warm-hot phase is known are highlighted in red. The true nonthermal broadening of O VII lines toward these sightlines might be larger than what we measure here in a single-phase scenario (see Section 3.3 for details).
Other Images in This Article
Copyright and Terms & Conditions
© 2024. The Author(s). Published by the American Astronomical Society.