

Image Details
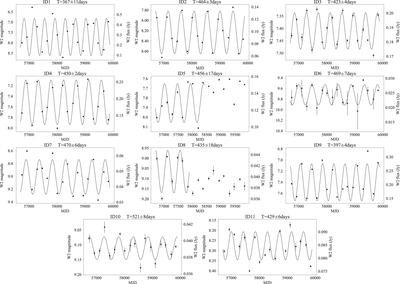
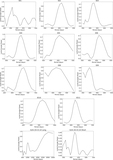
Caption: Figure 4.
The W2 light curves of the 11 discerned periodic YSO candidates. The photometric measurements were obtained by excluding the upper and lower 10% outliers and averaging the remaining exposures in each observation epoch from raw data. The y-axis scale exhibits both magnitude (left) and flux in janskys (right) in the W2 band. The black lines represent the best-fitting results with a sinusoidal function.
Other Images in This Article
Copyright and Terms & Conditions
© 2023. The Author(s). Published by the American Astronomical Society.

Copyright ©
2026 Astronomy Image Explorer. All Rights Reserved.
