

Image Details
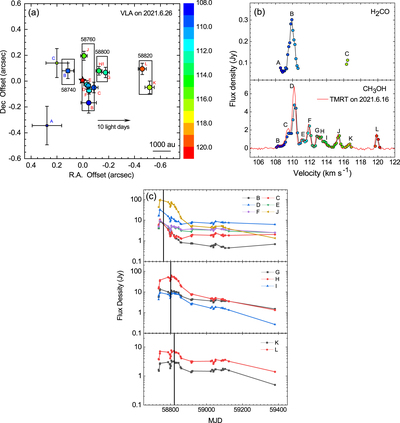
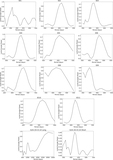
Caption: Figure 2.
(a) The spatial distributions of the maser features of the 6.7 GHz CH3OH and 4.8 GHz H2CO transitions were detected with the VLA on 2021 June 26. Each maser spot is represented by a filled circle (6.7 GHz CH3OH) or square (4.8 GHz H2CO) proportional to its flux density on a logarithmic scale, with its color indicating its Doppler velocity with respect to the local standard of rest. The millimeter continuum peak C1 position (R.A. = 18h35m08.ˢ139, decl. = ﹩-07^\circ 35^{\prime} 04\buildrel{\prime\prime}\over{.} 17;﹩ J2000), measured with ALMA band 6 by Hirota et al. (2022), is defined as the (0, 0) position. Boxes grouping the maser features display the expected MJD when the emission reached the maximum. (b) Flux density spectra acquired from a two-dimensional Gaussian brightness distribution fitting to the maser spots detected with the VLA. For comparison purposes, the 6.7 GHz methanol maser spectrum detected with TMRT at the last monitoring epoch (2021 June 16) is superimposed on the corresponding VLA spectrum. (c) Variation in the peak flux density of each 6.7 GHz CH3OH maser feature, with the exception of feature A, monitored with TMRT. Vertical lines represent the dates when the emission of the maser features reached the maximum, as derived from the light curves of the 6.7 GHz masers given in Figure 6 of Kobak et al. (2023). The feature marks of the 6.7 GHz maser (B–L) shown in the three panels are the same as those presented in its spectrum in Figure 1(a).
Other Images in This Article
Copyright and Terms & Conditions
© 2023. The Author(s). Published by the American Astronomical Society.

