

Image Details
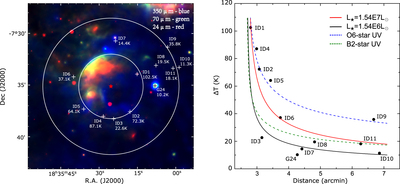
Caption: Figure 3.
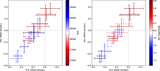
The left panel depicts the spatial distribution of 11 periodic variable sources and G24 marked by ID numbers and their temperature variations (△T). The background is a color-synthesized image using the Spitzer 24 μm (red) and Herschel 70 (green) and 350 (blue) μm bands. The red star in the center of the circles is the UV source (positioned at R.A. = 18h35m25.ˢ39, decl. = ﹩-07^\circ 35^{\prime} 07\buildrel{\prime\prime}\over{.} 4;﹩ J2000) detected with the Swift UVM2 ultraviolet image (Roming et al. 2005), which is deemed the driving source for the bubble and variability of the periodic variables. The masing region focused on in this work is associated with G24. The zoomed view of the spatial distributions of the maser features is shown in Figure 2(a). The right panel displays the relationship between the derived temperature variations (△T) and the projected distances to the UV source (r) with black dots. The solid red line represents the optimal fitting result obtained by applying the Stefan–Boltzmann law, assuming that the radiation from the driving source follows a blackbody model. According to the model proposed by Meyer et al. (2019), if the solid red line indicates the outburst stage, the solid black line represents the preburst stage. The model suggests that the luminosity increased by 1 order of magnitude after the outburst. The other two dashed lines of different colors illustrate the heating effect from the UV radiation of O6 and B2 stars, following Equation (10) in Ren & Li (2016).
Other Images in This Article
Copyright and Terms & Conditions
© 2023. The Author(s). Published by the American Astronomical Society.

