

Image Details
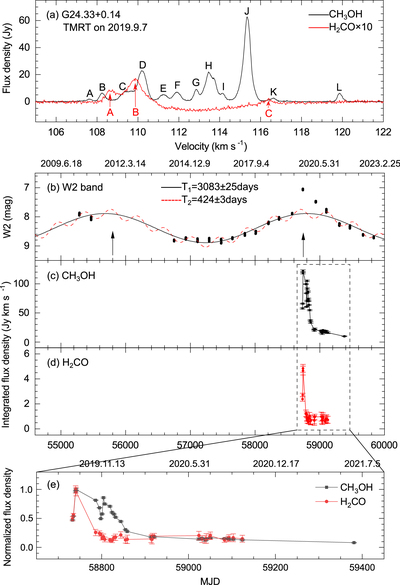
Caption: Figure 1.
Light curves of masers and the NEOWISE W2 band detection in G24. Panel (a) displays the representative spectra of the 6.7 GHz CH3OH (black) and 4.8 GHz H2CO (red) maser spectra detected on 2019 September 7 with TMRT. Panel (b) presents the light curve of the WISE and NEOWISE W2 band, overlaid with the fitted long (black) and short (red) periodic curves. The best-fitting periods and their uncertainties are indicated in the top right corner, while the two arrows highlight the two peaks of 6.7 GHz CH3OH maser variability in G24 (Wolak et al. 2019; Kobak et al. 2023). Panels (c) and (d) provide the light curves of the integrated intensity of the 6.7 GHz CH3OH and 4.8 GHz H2CO masers monitored with TMRT. Panel (e) contains the normalized light curves of the masers zoomed in on the time range defined by the dashed box in panels (c) and (d).
Other Images in This Article
Copyright and Terms & Conditions
© 2023. The Author(s). Published by the American Astronomical Society.

