Image Details
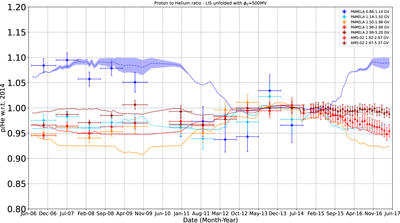
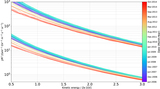
Caption: Figure 4.
Time profile of the proton-to-helium ratio at the rigidity intervals listed in the legend, normalized to the mean value of the ratios in the solar maximum period from 2013 May to 2014 September. The error bars are the quadratic sum of statistical and systematic errors. A weighted average over 9 months (with the exception of the last point before 2010, which is a weighted average over 10 months) was performed to reduce statistical fluctuation and the effect of the short-term cyclic variation in the solar minimum period. The AMS-02 data (Aguilar et al. 2018), normalized over the same solar maximum period, are shown for the period after 2014 September. The dashed lines are the proton-to-helium ratios and their corresponding uncertainties, colored bands, derived using the force-field approximation for solar modulation as described in Section 4.
Other Images in This Article
Copyright and Terms & Conditions
© 2022. The Author(s). Published by the American Astronomical Society.