Image Details
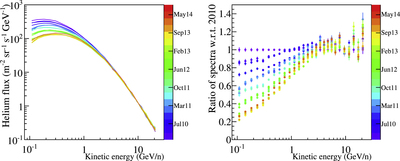
Caption: Figure 1.
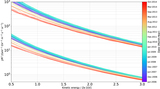
Left panel: the evolution of the helium energy spectrum as intensities approached the period of maximum solar activity, from 2010 January (violet) to 2014 September (red). Right panel: the ratio of the measured spectra with respect to the spectrum of 2010 January. The color code is the same as the right panel.
Other Images in This Article
Copyright and Terms & Conditions
© 2022. The Author(s). Published by the American Astronomical Society.
Copyright ©
2025 Astronomy Image Explorer. All Rights Reserved.