Image Details
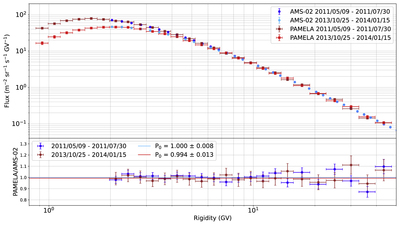
Caption: Figure 2.
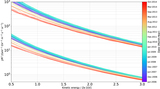
Top: PAMELA helium spectra measured in 2011 and late 2013 compared with the corresponding AMS-02 measurements (Aguilar et al. 2018), as indicated in the legend. The AMS-02 fluxes were averaged over three Carrington rotations. Bottom: the ratios between PAMELA and AMS-02 fluxes. A constant fit was performed on the ratios and the results (P0) are shown in the legend.
Other Images in This Article
Copyright and Terms & Conditions
© 2022. The Author(s). Published by the American Astronomical Society.
Copyright ©
2025 Astronomy Image Explorer. All Rights Reserved.