Image Details
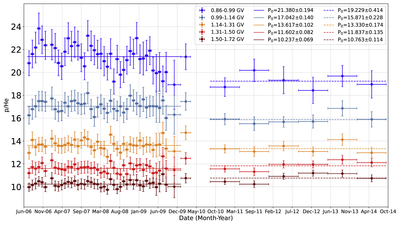
Caption: Figure 3.
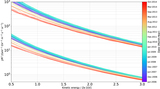
Time profiles of proton-to-helium ratio for the five rigidity intervals specified in the legend. The error bars are the quadratic sum of statistical and systematic errors. After 2009 the data points cover nine Carrington rotation time periods. The lines and P0 parameters resulting from the fit of a constant in each rigidity bin in the solar minimum (solid line) and maximum (dashed line) periods are also shown.
Other Images in This Article
Copyright and Terms & Conditions
© 2022. The Author(s). Published by the American Astronomical Society.
Copyright ©
2025 Astronomy Image Explorer. All Rights Reserved.