Image Details
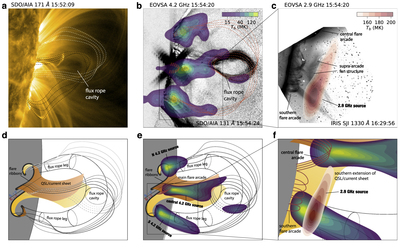
Caption: Figure 5.
Schematic of the microwave and EUV observations within the context of the 3D standard flare model (adapted from Janvier et al. 2014). (a) SDO/AIA 171 Å image just before the impulsive phase, showing loops surrounding the flux rope cavity. (b) Composite EOVSA 4.2 GHz and SDO/AIA 131 Å image during the impulsive phase (same as Figure 3(d)). (c) Enlarged view of the southern flare region, showing composite EOVSA 2.9 GHz image at 15:54:20 UT (red) and IRIS 1330 Å slit-jaw image at 16:29:56 UT (background reverse grayscale image). (d) Schematic for the pre-impulsive phase in (a). The central orange/yellow area represents parts of the 3D reconnection current sheet and the quasi-separatrix layer (QSL) below the flux rope. The ends of the hook-shaped footprints of the 3D QSL (or flare ribbons) are located near the legs of the erupting flux rope. Thin gray curves are representative pre-reconnection field lines. (e) Schematic for the post-reconnection scenario during the impulsive phase. The reconnected field lines below the null point become part of the central flare arcade (red curves), and those above the null point join the outer rim of the flux rope body (thin gray curves). Accelerated electrons propagate along the reconnected field lines and form the central microwave source. Some can arrive near the footpoints of the flux rope and produce the northern and southern microwave side sources. (f) Schematic of the southern extension of the 3D current sheet/QSL that has a face-on viewing perspective. The 2.9 GHz source is located above the southern flare arcade that appears later on in (E)UV images. Note to better show the 3D structures, unlike the observations, the active region in the schematics of (d) and (e) is rotated slightly inside the west limb.
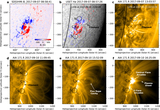
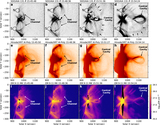
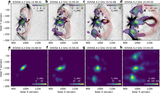
Other Images in This Article
Copyright and Terms & Conditions
© 2020. The American Astronomical Society. All rights reserved.