Image Details
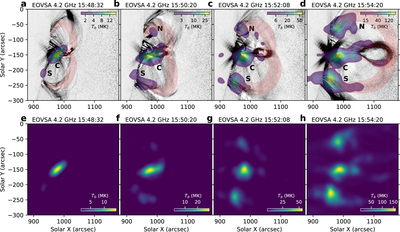
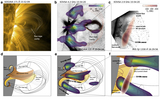
Caption: Figure 3.
Microwave imaging of the erupting flux rope. (a)–(d) SDO/AIA 131 Å images at four times during the eruption, enhanced using the unsharp masking technique (similar to Figures 2(a)–(d)). EOVSA contours from panels (e)–(h) are superposed. The flux rope structure seen in 131 Å (see Figure 2(a)–(d)) is outlined in pink. (e)–(h) EOVSA images at the same four times, made with multifrequency synthesis imaging using 11 spectral channels spanning the 3.85–4.50 GHz frequency range (centered at 4.2 GHz). Colors in each panel represent brightness temperature (Tb), linearly scaled to its maximum value as shown in the inset colorbars.
Other Images in This Article
Copyright and Terms & Conditions
© 2020. The American Astronomical Society. All rights reserved.