Image Details

Caption: Figure 1.
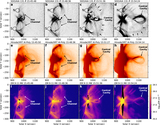
Preexisting filament that led to the X8.2 eruptive solar flare event. (a) SDO/HMI radial photospheric magnetogram on 2017 September 7. Red and blue indicate positive and negative magnetic polarity, respectively. (b) H-α image obtained by the USET telescope at a similar time as (a), shown in grayscale, with the magnetogram overlaid. The filament is seen as a reverse S-shaped dark structure located close to the magnetic polarity inversion line (PIL). Thick black curve indicates the limb location during the eruption on 2017 September 10. (c)–(f) SDO/AIA 171 Å images of the dark filament seen against the disk (c), ∼5 hr prior to the X8.2 event (d), during the eruption (e), and after the flare peak (f). Symbol “X” marks the center of the filament. Circles marked with “N” and “S” denote the northern and southern footpoints of the filament/flux rope, respectively. Their position in each panel is the same after compensation for solar differential rotation. An animation is available for the H-α and AIA 171 Å observations from 17:05 UT on 2017 September 7 to 16:42 UT on 2017 September 10. The realtime duration of the video is 19 s.
(An animation of this figure is available.)
The video/animation of this figure is available in the online journal.
Other Images in This Article
Copyright and Terms & Conditions
© 2020. The American Astronomical Society. All rights reserved.