Image Details
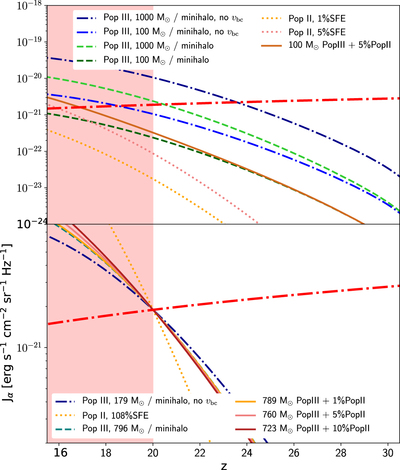
Caption: Figure 4.
Lyα flux as a function of redshift for our different models. Line styles and colors in the upper panel are the same as in Figure 3. In the lower panel, we show our best-fit models for a Population II component alone (dotted orange line), a Population III component alone (dashed green line), a Population III component that neglects streaming velocities (blue dotted–dashed line), and best-fit models with a Population II SFE of 1%, 5%, and 10% in combination with a Population III component (solid lines). The red dotted–dashed line shows the Lyα flux necessary for effective coupling (from Ciardi & Madau 2003). The shaded red area on the left represents the EDGES timing constraint.
Other Images in This Article

Copyright and Terms & Conditions
© 2019. The American Astronomical Society. All rights reserved.