Image Details
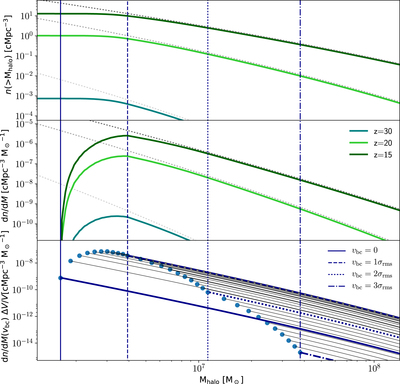
Caption: Figure 2.
Halo mass function. Upper panel: volume-averaged cumulative mass functions for star-forming minihalos for z = 30 (turquoise), z = 20 (green), and z = 15 (dark green), weighted by the volume fraction of different streaming velocity regions. Middle panel: differential mass function for star-forming minihalos for the same redshifts. In the upper two panels, the gray dotted lines show the situation without streaming velocities. Lower panel: mass functions for star-forming minihalos for small intervals around vbc, with Δ vbc = 0. 1σrms, evaluated at z = 20. Select velocities are highlighted with the dark blue lines. In all three panels, the vertical lines show the halo mass limit for star formation for the v0 (solid line), v1 (dashed line), v2 (dotted line), and v3 (dashed–dotted line) cases.
Other Images in This Article
Copyright and Terms & Conditions
© 2019. The American Astronomical Society. All rights reserved.