Image Details
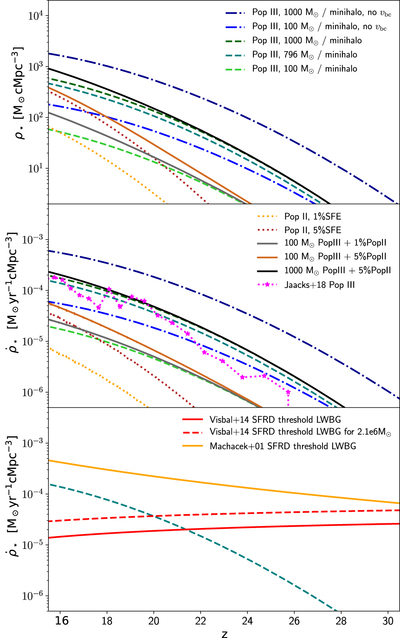
Caption: Figure 3.
Upper panel: comoving density in massive stars as a function of redshift. Middle panel: comoving SFRD. We show the results for a Population III component (dashed lines) and a Population II component (dotted lines) alone, as well as the combined models (solid lines). The dotted–dashed lines show Population III models when neglecting streaming velocities. The magenta line shows the SFRD from Jaacks et al. (2018) for comparison. Lower panel: comoving SFRD above which a Lyman–Werner background (LWBG) provides the stronger constraints on the minimum halo mass.
Other Images in This Article

Copyright and Terms & Conditions
© 2019. The American Astronomical Society. All rights reserved.
Copyright ©
2025 Astronomy Image Explorer. All Rights Reserved.