Image Details
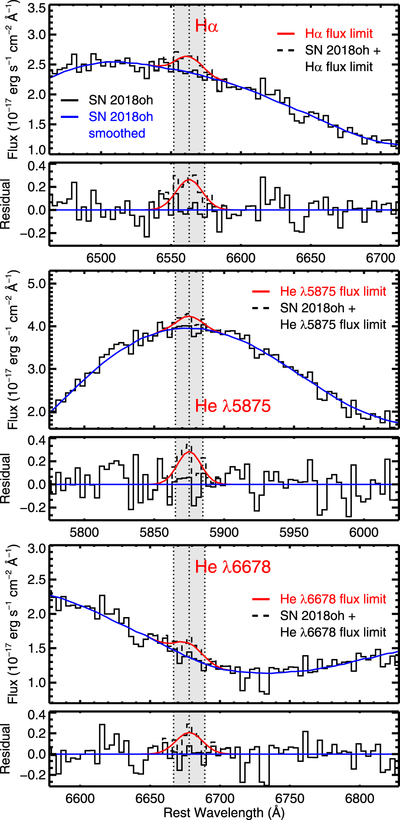
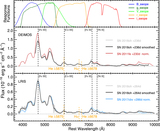
Caption: Figure 5.
DEIMOS spectrum of SN 2018oh zoomed in to show Hα (top panel), He I λ5875 (middle panel), and He I λ6678 (bottom panel). The flux is adjusted to what would have been seen 200 days after maximum brightness. The underlying continuum, which we approximate with a Savitsky–Golay smoothed (with a 180 Å filter) version of the spectrum, is displayed as blue solid lines. The gray-shaded region corresponds the ±22 Å (roughly 1000 km s−1) region around the rest wavelength of each line. In red, we insert a feature at the rest-wavelength of each line with a FWHM of 1000 km s−1 and a height corresponding to our 3σ detection limit above the smoothed continuum. With a dashed black line, we also show how such a feature would look in the data. For each feature, we also display the residuals relative to the continuum.
Other Images in This Article
Copyright and Terms & Conditions
© 2019. The American Astronomical Society. All rights reserved.