Image Details
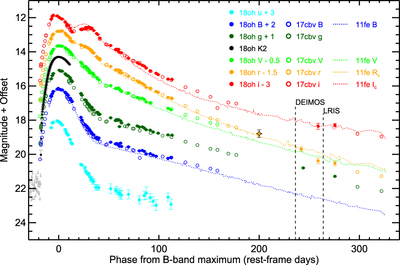
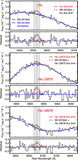
Caption: Figure 2.
Swope uBVgri light curves of SN 2018oh (full circles; offsets noted in the legend) compared to those of SN 2011fe (dotted line) and 2017cbv (open circles), where the light curves of the comparison SNe have been shifted to match the peak of SN 2018oh in each filter. The vertical black dashed lines correspond to the time of our DEep Imaging Multi-Object Spectrograph (DEIMOS) and Low Resolution Imaging Spectrometer (LRIS) spectra, as labeled on the figure. The orange star is our estimate of SN 2018oh’s r-band magnitude at 200 days after B-band maximum brightness (see Section 3). The data used to create this figure are available.
Other Images in This Article
Copyright and Terms & Conditions
© 2019. The American Astronomical Society. All rights reserved.