Image Details
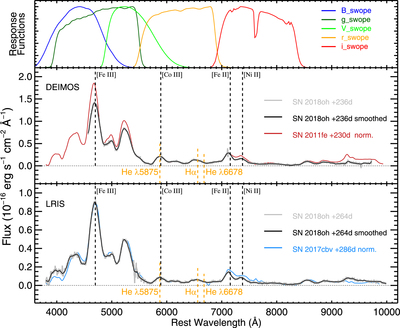
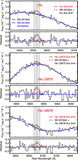
Caption: Figure 4.
Rest-frame nebular-phase (+236, middle panel, and 264, bottom panel, days form B-band maximum) spectra of SN 2018oh. We show the 3.5 Å binned spectra with gray and the 100 Å smoothed with black solid lines, respectively. We compare the spectra with the +230 days SN 2011fe spectrum (red; Graham et al. 2015) and the +286 days SN 2017cbv spectrum (blue; Sand et al. 2018). All spectra are normalized to the flux of SN 2018oh in the r-band of the Swope telescope at its corresponding phase, for which we plot the response functions of its broadband filters at the top panel. We also mark four iron-peak elements’ nebular-phase lines (vertical dashed black lines) and the three zero-velocity positions of the expected interaction lines from hydrogen and helium in the interaction scenario (vertical dashed orange lines). The data used to create this figure are available.
Other Images in This Article
Copyright and Terms & Conditions
© 2019. The American Astronomical Society. All rights reserved.