Image Details
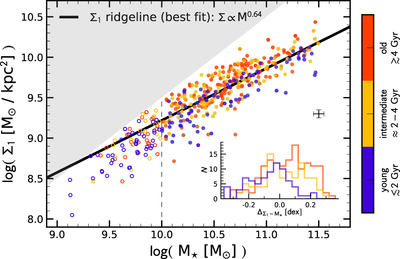
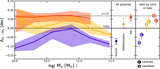
Caption: Figure 4.
At a given M⋆, QGs with a higher Σ1 are older. We plot Σ1 vs. M⋆ for QGs, color coded by the three mass-weighted age bins of Figure 3. Galaxies above the Σ1 ridgeline, indicated with the black line, are older than similar-mass galaxies below this line. The inset shows the distribution of distances from the Σ1 ridgeline for the three age categories.
Other Images in This Article
Copyright and Terms & Conditions
© 2017. The American Astronomical Society. All rights reserved.
Copyright ©
2026 Astronomy Image Explorer. All Rights Reserved.