Image Details
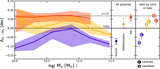
Caption: Figure 3.
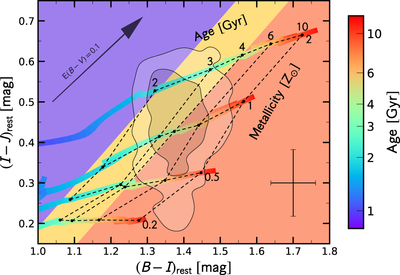
Breaking the age–metallicity degeneracy in the rest-frame (I − J) vs. (B − I) color–color plane. The colored lines represent quiescent Bruzual & Charlot (2003) τ-models with ﹩\tau =0.5,1,3,6,10,15\times {10}^{8}\,\mathrm{years}﹩ and ﹩\mathrm{sSFR}\lt {10}^{-11}\,{\mathrm{yr}}^{-1};﹩ the colors of the model lines refer to stellar mass-weighted age (as indicated in the color bar). The age–metallicity grid marked by the dashed lines is obtained from these τ-models. The geometry of the grid enables the identification of three, well-defined bins of mass-weighted stellar age for the QGs: ﹩\lesssim 2\,\mathrm{Gyr}﹩ (blue), ﹩\approx 2-4\,\mathrm{Gyr}﹩ (yellow) and ﹩\gtrsim 4\,\mathrm{Gyr}﹩ (red) marked by the three colored zones. The arrow in the top left corner shows a dust attenuation of ﹩E(B-V)=0.1;﹩ dust effects are roughly parallel to the lines of constant metallicity and do not significantly affect our age classification. The contours indicate the distribution of colors for our sample galaxies (enclosing 68% and 95% of the sample); the error bar in the bottom right corner shows the median uncertainty in the color estimates.
Other Images in This Article
Copyright and Terms & Conditions
© 2017. The American Astronomical Society. All rights reserved.