Image Details
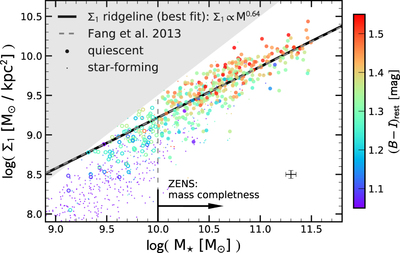
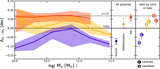
Caption: Figure 2.
At a given M⋆, galaxies with a higher Σ1 are redder. We plot Σ1 vs. M⋆, color coded by the rest-frame (B − I) color for the ZENS galaxies. The filled and empty large circles show the QGs above and below the mass completeness limit; the small dots indicate star-forming galaxies. The black and gray dashed lines show the best-fit ﹩{{\rm{\Sigma }}}_{1}\mbox{--}{M}_{\star }﹩ relation for the QGs, i.e., Σ1 ridgeline, obtained respectively from our data (Equation (1)) and by Fang et al. (2013) on their SDSS sample. The error bars in the bottom right corner show the average 1σ uncertainties; the gray shaded area marks the unphysical region of parameter space where ﹩{{\rm{\Sigma }}}_{1}\gt {M}_{\star }/\pi ﹩. At a given M⋆, QGs with higher Σ1 have typically redder (B − I) colors than QGs with lower Σ1.
Other Images in This Article
Copyright and Terms & Conditions
© 2017. The American Astronomical Society. All rights reserved.