Image Details
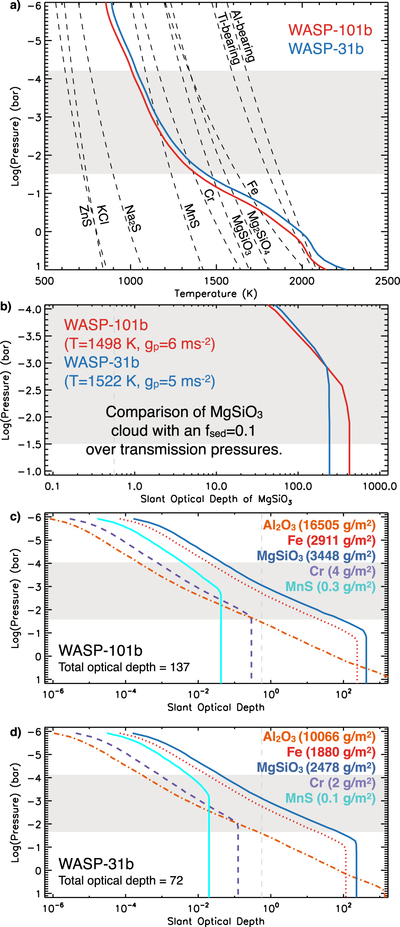
Caption: Figure 4.
(a) Temperature–pressure profile of WASP-101b (red; this work), with WASP-31b (blue; Sing et al. 2016). The condensation curves (dashed, labeled) indicate the different cloud species in the atmosphere where they cross the TP profile. The gray regions in each panel show the general pressure levels probed by transmission spectral observations. (b) Comparison between the slant optical depth of MgSiO3 at the pressures probed by transmission spectroscopy. ((c) and (d)) Slant optical depth of each cloud-forming species for a gray-scattering cloud with fsed = 0.1 in each atmosphere. We use the formulations in Ackerman & Marley (2001) to calculate the optical depth and total optical depth of all condensates in the atmosphere with the indicated cloud mass for each species.
Other Images in This Article

Copyright and Terms & Conditions
© 2017. The American Astronomical Society. All rights reserved.