Image Details
Caption: Figure 1.
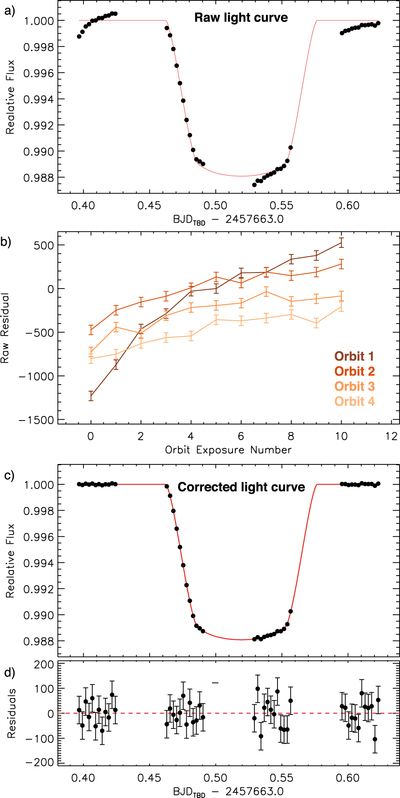
Band-integrated light curve and residuals. (a) Raw light curve (black points) and model (red). (b) Raw orbit-to-orbit residuals showing the gradient difference between HST orbit 1 and orbits 2–4. (c) Light curve corrected by the systematic model and the best-fit transit model (red). (d) Residuals in parts per million (ppm) of corrected light curve compared to the transit model (red dashed line).
Other Images in This Article
Copyright and Terms & Conditions
© 2017. The American Astronomical Society. All rights reserved.
Copyright ©
2025 Astronomy Image Explorer. All Rights Reserved.