Image Details

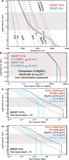
Caption: Figure 3.
Transmission spectrum of WASP-101b from our common-mode analysis (black points) and using marginalization (gray squares). We use the common-mode transmission spectrum and fit for the best 1D isothermal model (Fortney et al. 2010), which has T = 1250 K and a flat cloud deck ×100 the hydrogen cross-section (red). The model in blue shows the expected absorption feature for a clear atmosphere at the same temperature. The dashed line shows the null hypothesis.
Other Images in This Article

Copyright and Terms & Conditions
© 2017. The American Astronomical Society. All rights reserved.
Copyright ©
2025 Astronomy Image Explorer. All Rights Reserved.