Image Details
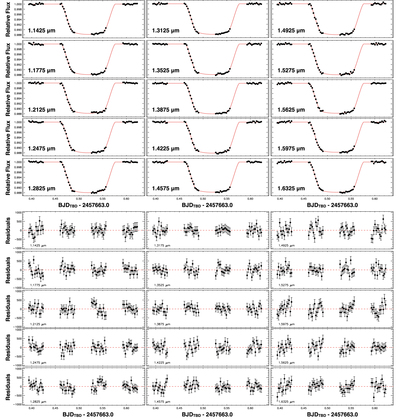
Caption: Figure 2.
Spectroscopic light curves and residuals for the common-mode method. Top: normalized and systematics-corrected data (points) and best-fit transit model (line) in 15 spectroscopic channels between 1.125 and 1.65 μm. Bottom: corresponding residuals (ppm) from the systematic corrected light curves with their 1σ error bars.
Other Images in This Article

Copyright and Terms & Conditions
© 2017. The American Astronomical Society. All rights reserved.
Copyright ©
2025 Astronomy Image Explorer. All Rights Reserved.