

Image Details
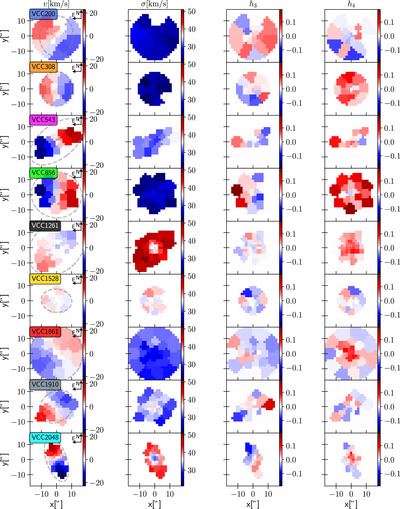
Caption: Figure 3.
The kinematic maps of the LOSVDs approximated by Gauss–Hermite expansion with fixed n GH = 4; i.e., this does not show potentially higher-order deviations. In a few bins, the recovered LOSVDs are essentially Gaussian because the optimum n GH was 2. This makes them appear white in the h 3,4-maps (the northernmost bin of VCC 200 was excluded due to its poor spectrum). We use a common spatial and color scale (see color bars on the right sides of the panels) to enable an easy comparison between different sample galaxies. Spatial variations within a given galaxy are more discernible in the radial profiles (Figure 4). In the velocity panels, we indicate north and east as well as the photometric 1.0r e aperture (dashed ellipse).
Other Images in This Article
Show More
Copyright and Terms & Conditions
© 2024. The Author(s). Published by the American Astronomical Society.

