

Image Details
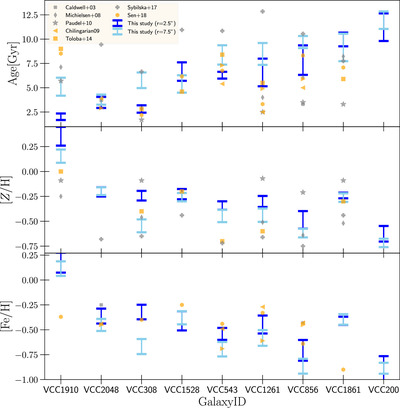
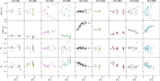
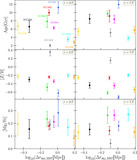
Caption: Figure 25.
Literature comparison of single stellar population properties. We ordered the galaxies from left to right by the average age we derived in the two apertures. (Top: age in gigayears; middle: metallicity [Z/H]; bottom: iron abundance [Fe/H] for the studies that trace metallicity in terms of [Fe/H].) We use [Z/H] = [Fe/H] + 0.94 · [α/Fe] (D. Thomas et al. 2003) to convert our metallicity [Z/H] to [Fe/H]. The blue error bars show our results for the central spectrum at r = 2.″5 (dark blue) and the outer one at r = 7.″5 (light blue). Studies with a spectral resolution of R ≳ 2000 are highlighted in orange, error bars from the literature are not shown, in order to avoid overcrowding (they are generally larger than our errors). Our results for the central spectrum of VCC 1910 are not trustworthy (see Section 2.3). For the values of I. V. Chilingarian (2009), we plotted the values for the circumnuclear region and the outer region; we indicate the region by the direction of the arrow. We excluded the results of A. Ryś et al. (2013, 2015) from this plot, as they are models composed of two different stellar population models; although we note that they employed the same data as A. Sybilska et al. (2017). We are not aware of any existing analysis for VCC 200.
Other Images in This Article
Show More
Copyright and Terms & Conditions
© 2024. The Author(s). Published by the American Astronomical Society.

