

Image Details
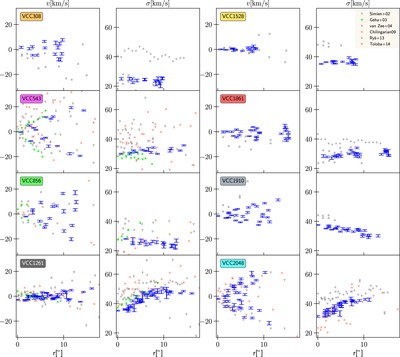
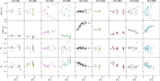
Caption: Figure 24.
Literature comparison for the mean (line-of-sight) velocity and dispersion. In this paper, we differentiate between sample galaxies using the color-coding indicated by the background color of the label here. There is no published data available for VCC 200, so we excluded it from this plot. The color-coding that is used for VCC 200 in all other Figures is dark blue. To avoid overcrowding, we do not show error bars for the literature. For the studies where we did not find any raw data in a table format, we reverse-engineered the approximate values from their figures. A few literature data points are not displayed here because they lie outside the plot boundaries. Blue with error bars: our kinematic data (see also Figure 4). Gray triangles: data from F. Simien & P. Prugniel (2002). Green dots: data from M. Geha et al. (2003). Gray diamonds: data from L. van Zee et al. (2004). Red stars: data from I. V. Chilingarian (2009). Gray dots: dispersion from the IFU study of A. Ryś et al. (2013). Since they have ∼100 Voronoi bins, we only plot the dispersion averaged within ellipticals bins, as shown in Figure 5 of A. Ryś et al. (2013). This reduces their high bin-to-bin scatter in the dispersion significantly, yet the higher dispersion remains. Their mean velocities were not displayed in the same manner, which is why they are not shown here. Gray squares: data from E. Toloba et al. (2014).
Other Images in This Article
Show More
Copyright and Terms & Conditions
© 2024. The Author(s). Published by the American Astronomical Society.

