

Image Details
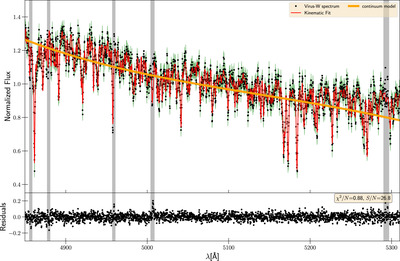
Caption: Figure 22.
Top: example of a typical Voronoi-binned spectrum (one of the bins of VCC 200 within the central 5″). Black: the observed VIRUS-W spectrum. The green band around the data indicates the 1σ flux uncertainty. Red: the corresponding fit model. Orange: the continuum modeled by a second-order multiplicative polynomial. The gray regions indicate the parts that were masked before the fit. Bottom panel: the residuals between fit and data.
Other Images in This Article
Show More
Copyright and Terms & Conditions
© 2024. The Author(s). Published by the American Astronomical Society.

Copyright ©
2026 Astronomy Image Explorer. All Rights Reserved.
