

Image Details
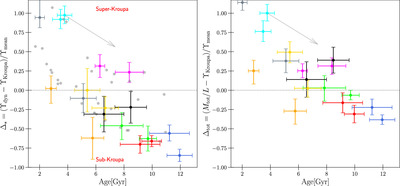
Caption: Figure 18.
Left panel: the relative differences Δ* of stellar mass-to-light ratios derived from single stellar population analysis ϒKroupa and dynamical modeling as a function of age of the SSP. Dots with error bars: the differences of the two mass-to-light ratios we derived from the VIRUS-W spectra binned at r = 2.″5 and r = 7.″5 (Section 2.3). Gray dots: the differences when ϒKroupa values are based on literature stellar population results (see Appendix B). The dotted, horizontal line indicates identical population and dynamical results. Assuming the dynamical results are correct, galaxies that lie above this horizontal line would require a super-Kroupa IMF, while galaxies below it would require a sub-Kroupa IMF. Right panel: similar to the left panel, but instead of comparing ϒKroupa with the decomposed stellar component ϒdyn, the population ratio is compared to the total dynamical mass-to-light ratio M tot/L; i.e., the dark matter component is included in the mass. Using VCC 2048 as an example, the diagonal arrow symbolizes how an (unrealistically) large error in the SSP age would shift Δ* and Δtot. We measure VCC 2048's population to be young, but if it were actually twice as old (∼8 Gyr), ϒKroupa would be higher, and the galaxy should actually be at the arrow’s head if we measured its age correctly.
Other Images in This Article
Show More
Copyright and Terms & Conditions
© 2024. The Author(s). Published by the American Astronomical Society.

