

Image Details
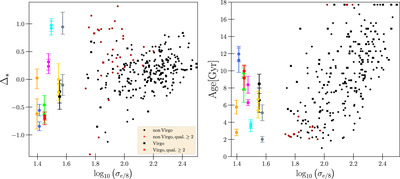
Caption: Figure 17.
A comparison of the IMF parameter (left) and the single stellar population age (right) of dEs with those of the “ordinary” ETGs from the ATLAS3D-survey (M. Cappellari et al. 2011). All galaxies are shown vs. their central velocity dispersion (measured within r e/8), which is essentially a proxy for their total mass. ATLAS3D ETGs that reside in Virgo are highlighted using squares, while the others are shown as circles. We calculated the Δ* for a Kroupa IMF by transforming the mass-to-light ratios from M. Cappellari et al. (2013a), which were given for a Salpeter IMF. The SSP equivalent age of the ATLAS3D galaxies was obtained from R. M. McDermid et al. (2015) and is stated within a 1r e aperture. For our dEs, we show the results for both apertures that we analyzed. M. Cappellari et al. (2013a) and R. M. McDermid et al. (2015) flag their galaxies depending on the quality of the data and analysis. For details on the definition of these flags, see the corresponding studies. We show galaxies flagged with the best quality in black and “bad” galaxies that may not be as reliable in red.
Other Images in This Article
Show More
Copyright and Terms & Conditions
© 2024. The Author(s). Published by the American Astronomical Society.

