

Image Details
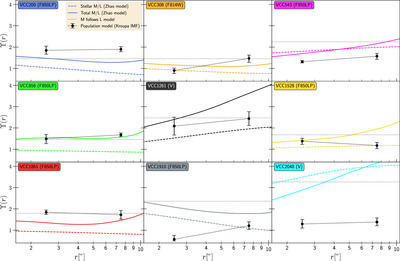
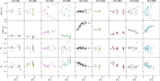
Caption: Figure 16.
Comparison of the local mass-to-light ratio ϒ as a function of radius r[″] for all Virgo dEs as obtained from different models. Each panel shows one dE, with the box showing its VCC-id and the band in which the mass-to-light ratio is measured (see Figure 2). The colored lines show the mass-to-light ratios we derived using dynamical modeling. Dashed lines: the projected ϒ* of the dynamically decomposed stellar component. Solid lines: the total 3D dynamical mass-to-light ratio ϒtot (i.e., including the dark matter). Note that ϒtot is not a projected quantity, as this would include all of the dark matter along the LOS, i.e., even the poorly constrained DM far outside a galaxy’s FOV. This can make the projected ϒ* appear to be higher than the 3D ϒtot values at some radii, even though the latter is by definition the upper bound for the 3D stellar mass-to-light ratios. The gray, dotted horizontal line shows the mass-to-light ratio of the best mass-follows-light model (i.e., a dynamical orbit model with no dark matter and stellar ϒ-gradient). The black dots with error bars show the stellar mass-to-light ratio from the population analysis (Section 2.3) in the two annuli centered around r = 2.″5 and 7.″5. We also draw a connecting line between the two points to highlight a population gradient if it exists.
Other Images in This Article
Show More
Copyright and Terms & Conditions
© 2024. The Author(s). Published by the American Astronomical Society.

