

Image Details
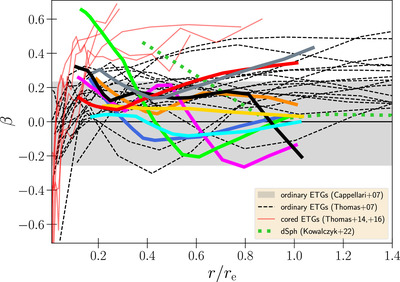
Caption: Figure 14.
The spherical anisotropy parameter β (Equation (4)) vs. radius scaled by the effective radius. The typical size of the FOV for our dE sample is about 1.0r e, and outside of the FOV, the anisotropy is not well constrained. The same is the case for radii smaller than the spatial resolution limit. Using our error estimation criterion (Section 2.4), we find a typical 1σ error of the anisotropy parameter of Δβ = 0.065 (within 1 kpc), with VCC 856 being the most uncertain at Δβ = 0.11. Red curves: the anisotropy profiles of giant cored ETGs (J. Thomas et al. 2014, 2016). Due to black hole scouring, these have formed tangentially anisotropic cores (≲0.05r e) within a radially anisotropic envelope. Black dashed lines: ETGs from the sample of J. Thomas et al. (2007), which mostly consists of “ordinary” ETGs with magnitudes within M B ∈ [ −18.8, 22.6] mag. Gray band: the 90th percentile of the anisotropies of the 23 “ordinary” ETGs of M. Cappellari et al. (2007). Note that these values are radial averages. If the orbital structure changes from tangential to radial (as is often the case), then this averaging can make the galaxy appear closer to β = 0 than it actually is. Green, dotted line: the Fornax dSph from K. Kowalczyk & E. L. Łokas (2022).
Other Images in This Article
Show More
Copyright and Terms & Conditions
© 2024. The Author(s). Published by the American Astronomical Society.

