

Image Details
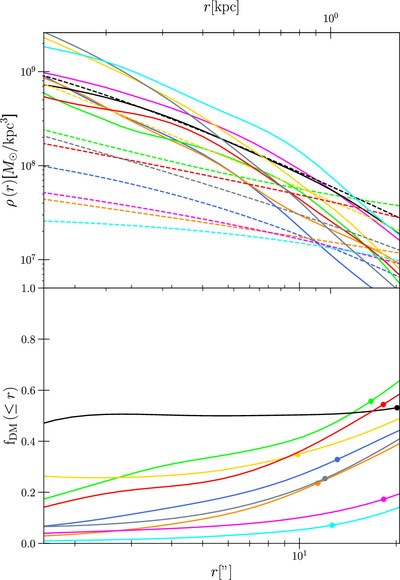
Caption: Figure 12.
Top panel: the (spherically averaged) matter densities for the dE sample that we obtained from the best AIC p model found for each dE. Solid curves: the stellar density (including the ϒ* gradients). Dashed curves: the corresponding dark matter halo density as modeled by the Zhao parameterization (Equation (2)). Bottom panel: the cumulative dark matter fraction f DM within radius r. The dots highlight the value of f DM at one stellar effective radius; the typical radial extent of the kinematic data is 1.0r e.
Other Images in This Article
Show More
Copyright and Terms & Conditions
© 2024. The Author(s). Published by the American Astronomical Society.

