Image Details
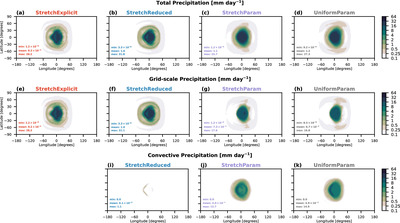
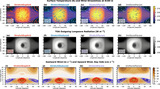
Caption: Figure 6.
Maps of time mean precipitation rate in millimeters per day, from top to bottom: total, grid-scale, convective. Note that there is no convective precipitation in the StretchExplicit simulation because the convection parameterization is switched off.
Other Images in This Article
Copyright and Terms & Conditions
© 2024. The Author(s). Published by the American Astronomical Society.
Copyright ©
2025 Astronomy Image Explorer. All Rights Reserved.